4 minutes
AB Testing Cheat Sheet
Introduction
We create 2 versions of a product or a website with just a little change to a single variable. Then, we will show 2 versions to two similarly sized audiences and analyze which one performs better over a specific period of time.
The existing version is the control group and another one with changes is the experimental group.
Can Do & Can’t Do
Can Do:
- just for a small change at one time
- makes changes gradually
Can’t Do:
- mostly for shot-term evaluations, not for long-term
- not for brand-new products or features
Pros and cons
Pros:
- helps draw causal conclusions
- makes changes gradually
Cons
- takes time when don’t have enough traffic
- doesn’t solve usability problems
Experiment Design
Metric Choice
Invariant metrics are those which remain invariant throughout the experiment. One could expect a similar distribution of such metrics both on control and experiment side. In the given experiment, the invariant metrics are as follows.
Evaluation metrics are chosen since there is a possibility of different distribution between experiment and control groups as a function of experiment. Each evaluation metric is associated with a minimum difference that must be observed for consideration in the decision to launch the experiment. The ultimate goal is to minimize student frustration and use the limited coaching resources most efficiently. With this in mind, the following conditions must be satisfied.
Metric Measurement
Sensitivity is an ability that metrics are sensitive enough to capture the changes we care about.
Robustness is an ability that metrics are steady enough to not capture the changes we don’t care about.
To measure sensitivity and robustness we can:
- A/A test: Both control and experiment groups are exposed to the same version, then metrics should be similar in 2 group if they are robust enough.
- Retrospective analysis: Depands on the history data, then we can analyze and evaluate robustness
Choice of Experimental Unit and Population
Experimental unit is the minimul unit to define which user or which event is assigned to the control and experiment group. It is an unique identifier like a user id, a cookie, or event id. When we choose an experimental unit, we should consider 3 import things:
- User consistency: we have to recognize different users, making users have consistent experience throughout.
- Ethical considerations: Some ethical considerations are risk, benefit and privacy. For example: discriminatory pricing would make users uncomfortable.
- Variability of metric: The choice of unit of diversion can greatly impact the variability of a metric.
Population is the people we are trying to implement an experiment on.
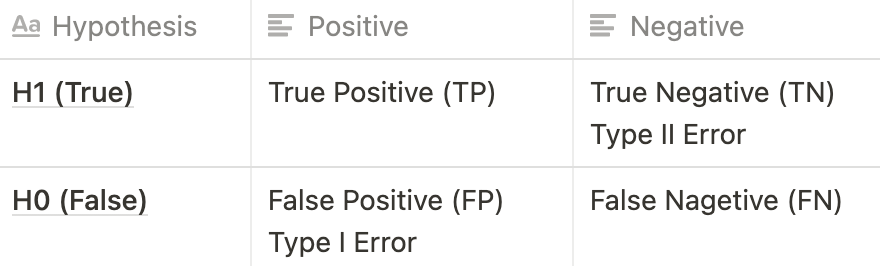
Hypothesis
Null Hypothesis is that this approach might not make a significant change and might not be effective in your expectation.
Alternative Hypothesis is that this might meet your expectation.
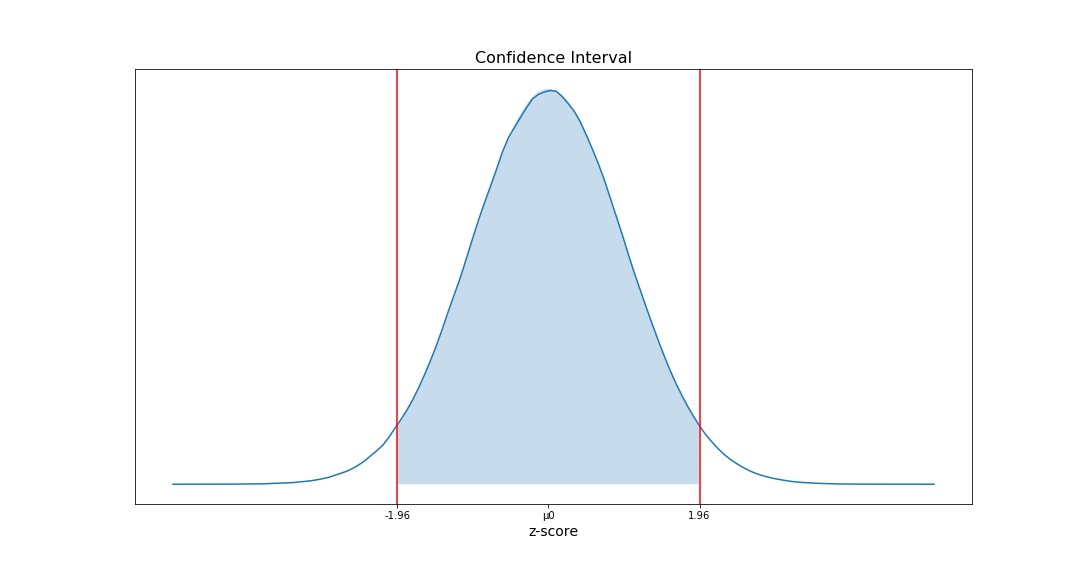
Confidence Intervals
Confidence Interval is a range of values we are fairly sure our true value lies in. A 95% confidence interval is a range of values that you can be 95% certain contains the true mean of the population.
Z-Score tells you how many standard deviations from the mean your score is. Assuming a normal distribution, your z score would be: z = (x – μ) / (σ / √n) The below graph shows the 95% confidence interval and the corresponding z-score is between -1.96 and 1.96.
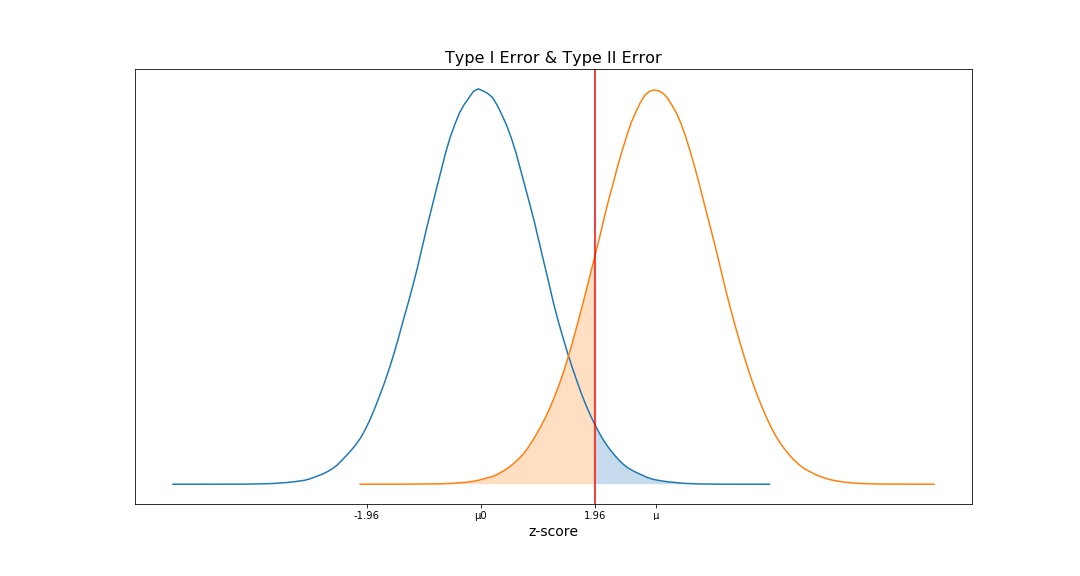
α & β
Significance Level, α, is the probability of rejecting the null hypothesis when it is true (Type I Error). For example, a significance level of 0.05 indicates a 5% risk of concluding that a difference exists when there is no actual difference.
Statistical Power, 1 - β, is the probability of a hypothesis test of finding an effect if there is an effect to be found. β refers to the probability of Type II error in a statistical hypothesis test.
Minimum Detectable Effect
Minimum Detectable Effect, MDE represents the relative minimum improvement over the baseline that you’re willing to detect in an experiment, to a certain degree of statistical significance. The lower MDE, the more traffic you need to detect minor changes, hence the more money you have to spend on driving that traffic. There’s no such thing as an ideal MDE, so take money, time, and other business risks into consideration when defining MDE.
Duration of the experiment
The duration of the experiment is related to the fraction of the traffic you wish to send through the experiment. If you need a total of 20K users for your experiment and sending 500 users per group per day, you would need to run the experiment for 20 days. However, once the number of users meets your requirement, you should stop the experiment to avoid more users.
Summary
Quick Tips
- Only conduct one test at a time
- Test one variable at a time
- Test minor change
- Split your sample group randomly
- Test 2 versions at the same time
- Decide what you want to test
- Decide on the necessary significance level before testing