5 minutes
K-means: Quickly Review Data in Datathon
K-means clustering is a widely used and easy-applied algorithm! In this article, I would quickly review clustering methods and show how I used this during the Datathon.
Clustering
Clustering is the most common task in a real-life situation, for example, an e-commerce company usually divides customers into different groups and give them customized campaigns. Also, a factory group the same functional machines to be back up in order to maintain the high yield-rate when one machine is broken. The goal of clustering is to make objects more similar in the same group and more different between different groups. There are 4 steps of clustering analysis.
Step 1: Data Preparation
Every single time when you want to implement machine learning algorithms, you should prepare data for this analysis. According to a question or an issue you are going to solve, you have to choose important features. This is an essential step, but I would not talk this too much today.
Step 2: Choose a Measure of Similarity
Distance
In the real world, people living in the same areas have some common habits. Take food culture as an example, People living in Korea love to eat spicy food, but in Japan don’t. Therefore, in genomics, the distance is a good and easy-understood metric.
There are 2 common ways to calculate distance:
- Euclidean Distance: the straight-line distance between two points
- Manhattan Distance: the sum of the absolute distances along each axis
Correlation Coefficient
This metric is used in statistics to measure how strong a relationship is between two variables.
Density
Sometimes, distances can’t represent similarities. For instance, 2 groups have different shapes, a circle, and a donut. In this situation, the density would be a good metric to measure similarities!
Step 3: Choose an Algorithm
Hierarchical Clustering
Like a dendrogram, one group is divided into 2 from top-down or 2 clusters are merged as one moves up the hierarchy.
Partitional Clustering
Choose n centroids, then the algorithm will divide points into n clusters based on measures of the similarity.
Step 4: Evaluation
Distortion We compute the sum of squared distances from each point to its assigned center and try to get the minimum. However, the more clusters you group, the smaller distortion you will get. Hence, we need to find a balance and get the smallest distortion by clustering the fewest groups.
Silhouette
We compare the mean distance (a) within clusters within the mean nearest-cluster distance (b) for each sample. Moreover, we try to get a rate between 1 and -1, so we divide this number with the bigger one between a and b like the following equation: (b - a) / max(a, b). In a word, we want the highest silhouette.
Hands-on K-means
A partitional clustering also one of unsupervised learning method. Without a specific label, you just give features and k clusters, then K-means will cluster data points together by distances. In the first round, the algorithm gives k centroids and group points into the closest one. In the next round, the algorithm re-calculates centroids of current clusters, so centroid positions will change. Until centroids don’t change, our clustering is finished!
However, the critical point about K-means is how to decide the parameter k, how many clusters you want to use to describe your data. Also, the initial centroid positions have an impact on the clustering result.
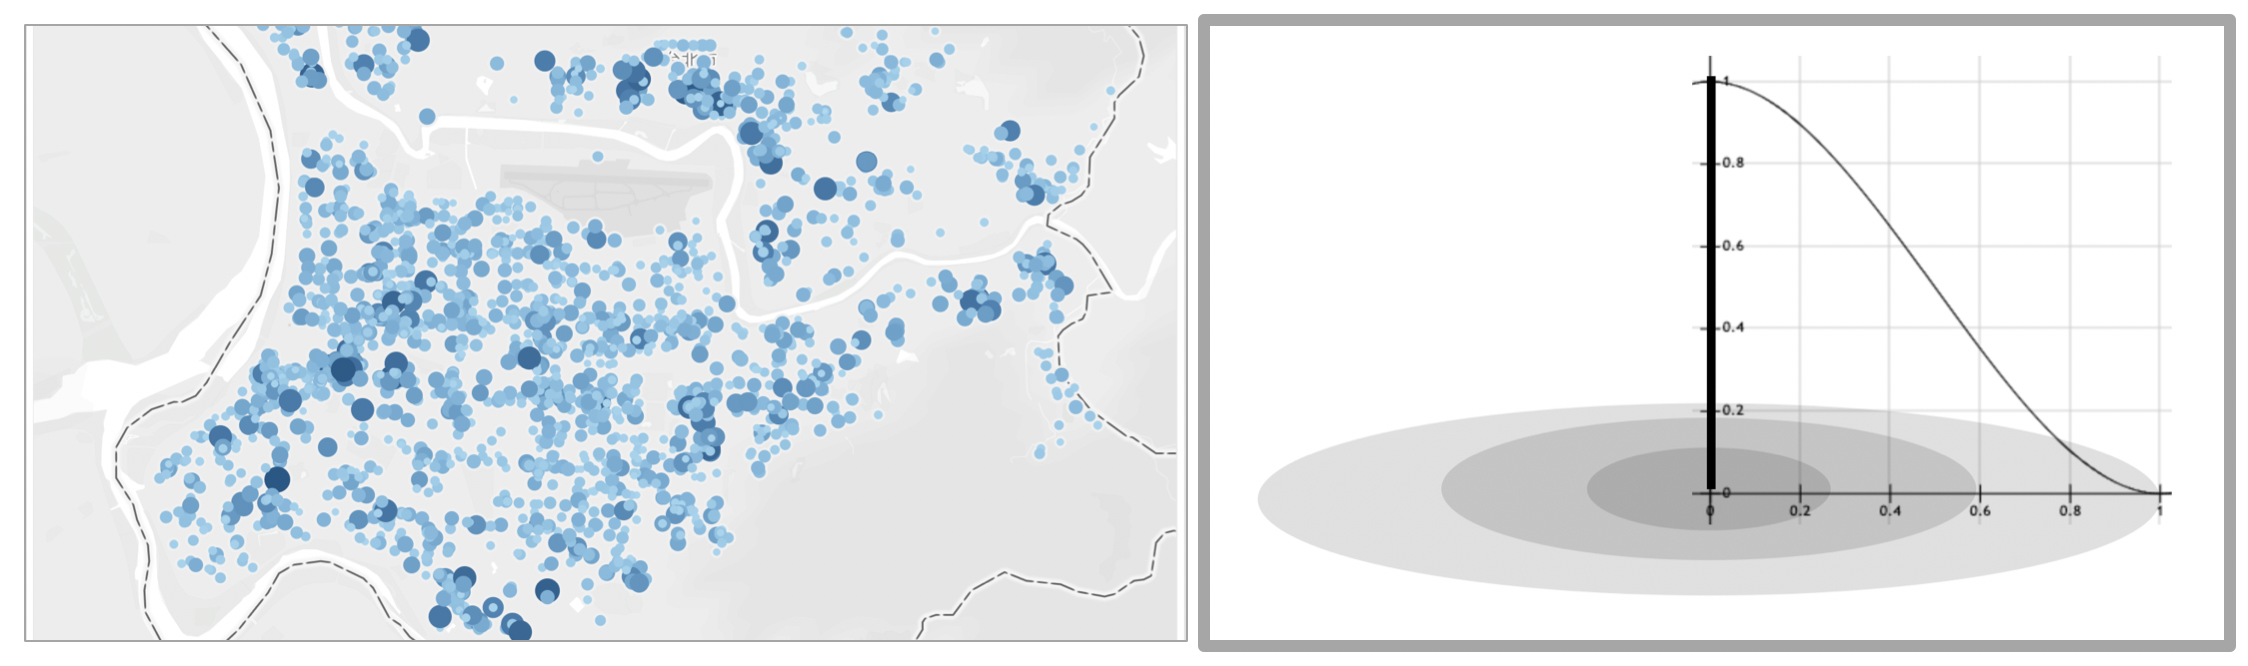
The Question and Data Preparation
For our Datathon task, we decided to predict people’s numbers in gyms. Gyms located in a business area and a residential area have different customer groups, and this feature has a huge influence on prediction. Thus, we considered invoice data could help us decide types of areas.
The numbers of invoice meant crowds, so we could define streams of people nearby gyms. Closer people are to gyms, stronger influence streams had on people numbers in gyms. Therefore, we chose 12 Taipei sports centers to be centered, and the numbers of invoice times distance from stores to centroids times and times a function to be our key feature.
Clustering Sports Centers
After cleaning data, let’s apply K-means!
import pandas as pd
from sklearn.cluster import KMeans
from sklearn.metrics import silhouette_score
import matplotlib.pyplot as plt
%matplotlib inline

table = pd.read_csv('data.csv', index_col='gym_name')

distortion = []
silhouette = []

for i in range(2, 10):

    kmeans = KMeans(n_clusters=i, random_state=0).fit(table)
    distortion.append(kmeans.inertia_)
    silhouette.append(silhouette_score(table, kmeans.labels_))

fig, (ax1, ax2) = plt.subplots(1, 2, sharex = False, sharey = False, figsize = (12, 6))

ax1.set_xlabel('the number of clustering', fontsize = 12)
ax1.set_ylabel('Distortion', fontsize = 14)
ax1.plot(list(range(2, 10)), distortion, color = 'blue', linewidth = 2)

ax2.set_xlabel('the number of clustering', fontsize = 12)
ax2.set_ylabel('Silhouette', fontsize = 14)
ax2.plot(list(range(2, 10)), silhouette, color = 'green', linewidth = 2)
fig.savefig('kmeans_metrics.png')
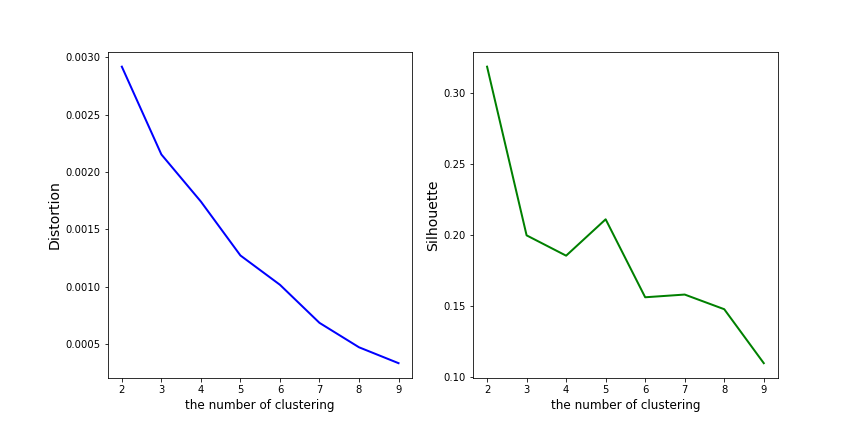
According to the photo, there is no apparent elbow point, while clustering 2 groups makes me get the highest silhouette.
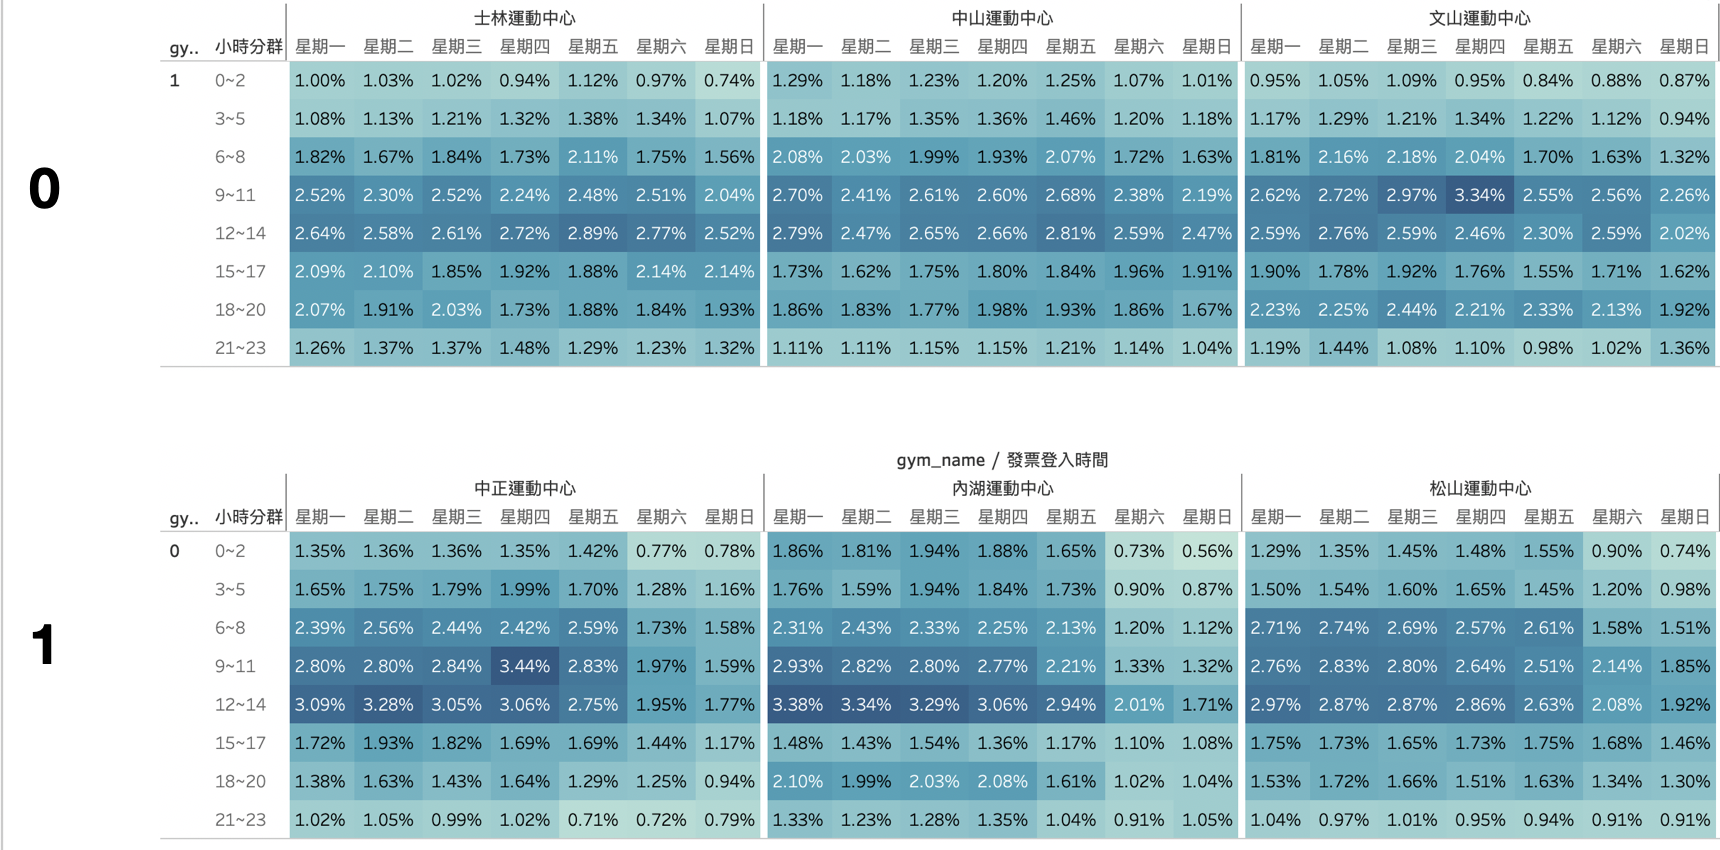
2 Types of Sports Centers
According to the below heatmap, type 1 centers have fewer people used during weekends. After looking into this, we find out that type 1 centers are nearby business buildings, hence nobody goes there during the holidays!
Conclusion
K-means is a good way to quickly review your data, however, you should looking into your data in detail and make sure that the clustering result makes sense!