3 minutes
Sportportal: People Numbers Prediction in 2020 Datathon
I always grab any chance to get hands-on experience also try to solve a real problem. Recently, my 2 ex-colleagues at Gogoro with me joined in 2020 Datathon, like a workshop. I am writing to share my steps and the solution!

Before Coding
In the beginning, we don’t limit our thoughts on data the host provides, then we come up with so many ideas. That’s to say, the host provides invoice data, weather data, and internet posts, therefore people no doubt do analysis on the relationship between weather and consumption habits. To avoid things most people do, we provide ideas based on our daily experience!
Do a Small Thing
Due to Only 40 hours, 3 people, and limited resources, we should have an acceptable, useful, and executable solution. To be more specific, we just try to solve a small pain point, Workout! It’s so difficult to do workout regularly, even more, difficult to work out in a crowded gym. Sometimes, I just get there and wanna back home directly because there are too many people. Apparently, if someone could tell me what time is good for me to go to a gym, I can save time and arrange my schedule more properly. Our target is to build a site, Sportportal, showing real-time people numbers in gyms and prediction .
Check Resources
In order to do Sportportal, we decide to use weather data to predict people’s numbers in a gym. There are 12 sports centers in Taipei, roughly scattered around 12 Taipei district. Also, weather prediction is divided into every single district in Taipei. Weather and willingness about workout seem correlative, so we work in this direction.
Data List
- weather history data
- weather prediction
- gym people number history data
- real-time gym people number
Let’s Do Coding
After you have a good idea, it’s time to test your coding ability. Mostly, I feel the time is the scarcest resource, so we just need to do MVP (Minimum Viable Product) to show our idea. The below diagram is our data pipeline.
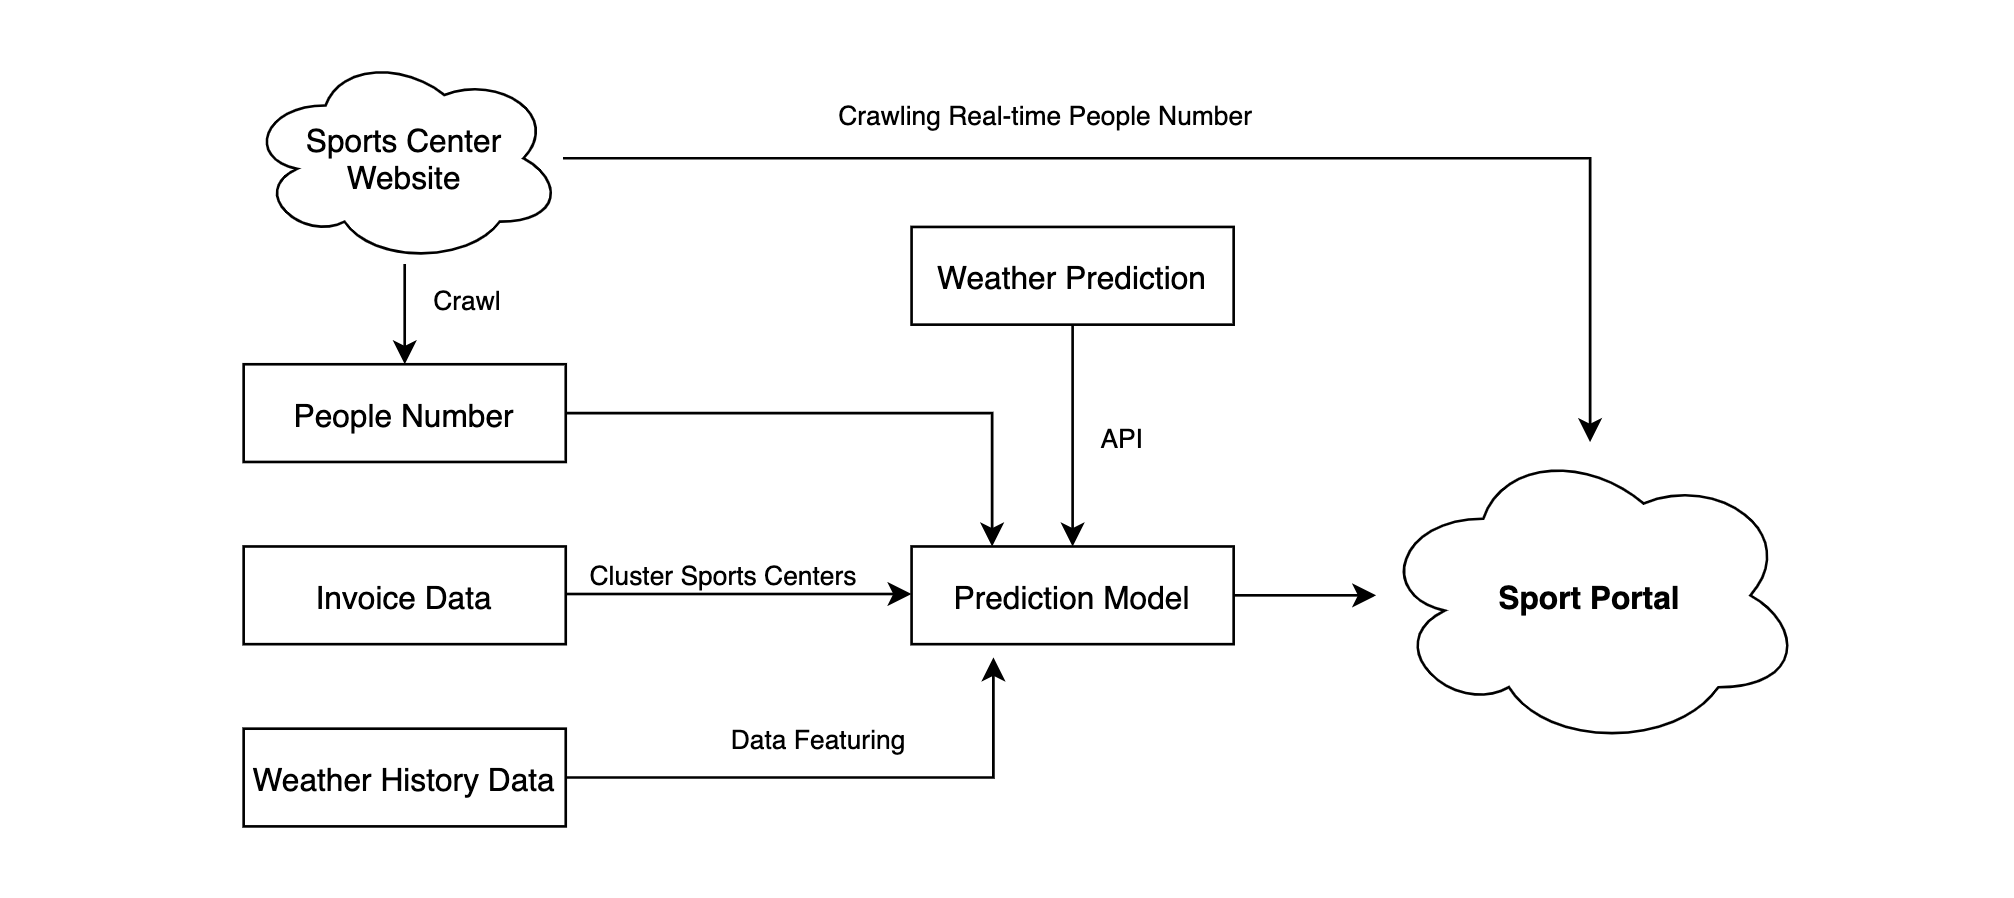
People Number in GYM
We can’t find gym people number history data, so we write a crawler to get people numbers in gyms and restore them. However, since registration into this Datathon, we only have 7 days to collect data. It turns out that we don’t have enough labels.
Open Weather Data
Suprisely, our government has done open weahter data API so well including prediction and history data. All things we have to do is to call API!
Invoice Data
Gyms located in a business area and a residential area have different customer groups, and this feature has a huge influence on prediction. Thus, we considered invoice data could help us decide types of areas.
Moreover, the numbers of invoice meant crowds, so we could define streams of people nearby gyms. Closer people are to gyms, stronger influence streams had on people numbers in gyms. Therefore, we chose 12 Taipei sports centers to be centered, and the numbers of invoice times distance from stores to centroids times and times a function to be our key feature. Check out this to realize more!
Conclusion
We use invoice data to classfy 12 sport centers into 3 clusters. For example 1 kind of sport centers is located at business areas, so there are few people during weekends. This is our important feature! All judges agree with this idea. However, we don’t have enought gym people number history data to verify our model.
Hackathon is a good way to strengthen your brain muscle, absorb others’ creative ideas, learn effective coding skills. Thus, I am glad to join this with my partners and willing to have more!